A Snapshot of the Digital Age in Sweden
For most people, technology has become an indispensable part of their lives. A trend that the pandemic has accelerated even more.
Following an increased reliance on technology at home, TechBuddy, reveals new data lifting the curtain on how Sweden is really dealing with the digital world.
TechBuddy offers a range of services, for those struggling with tech, or those who require tasks such as installation to free their time.
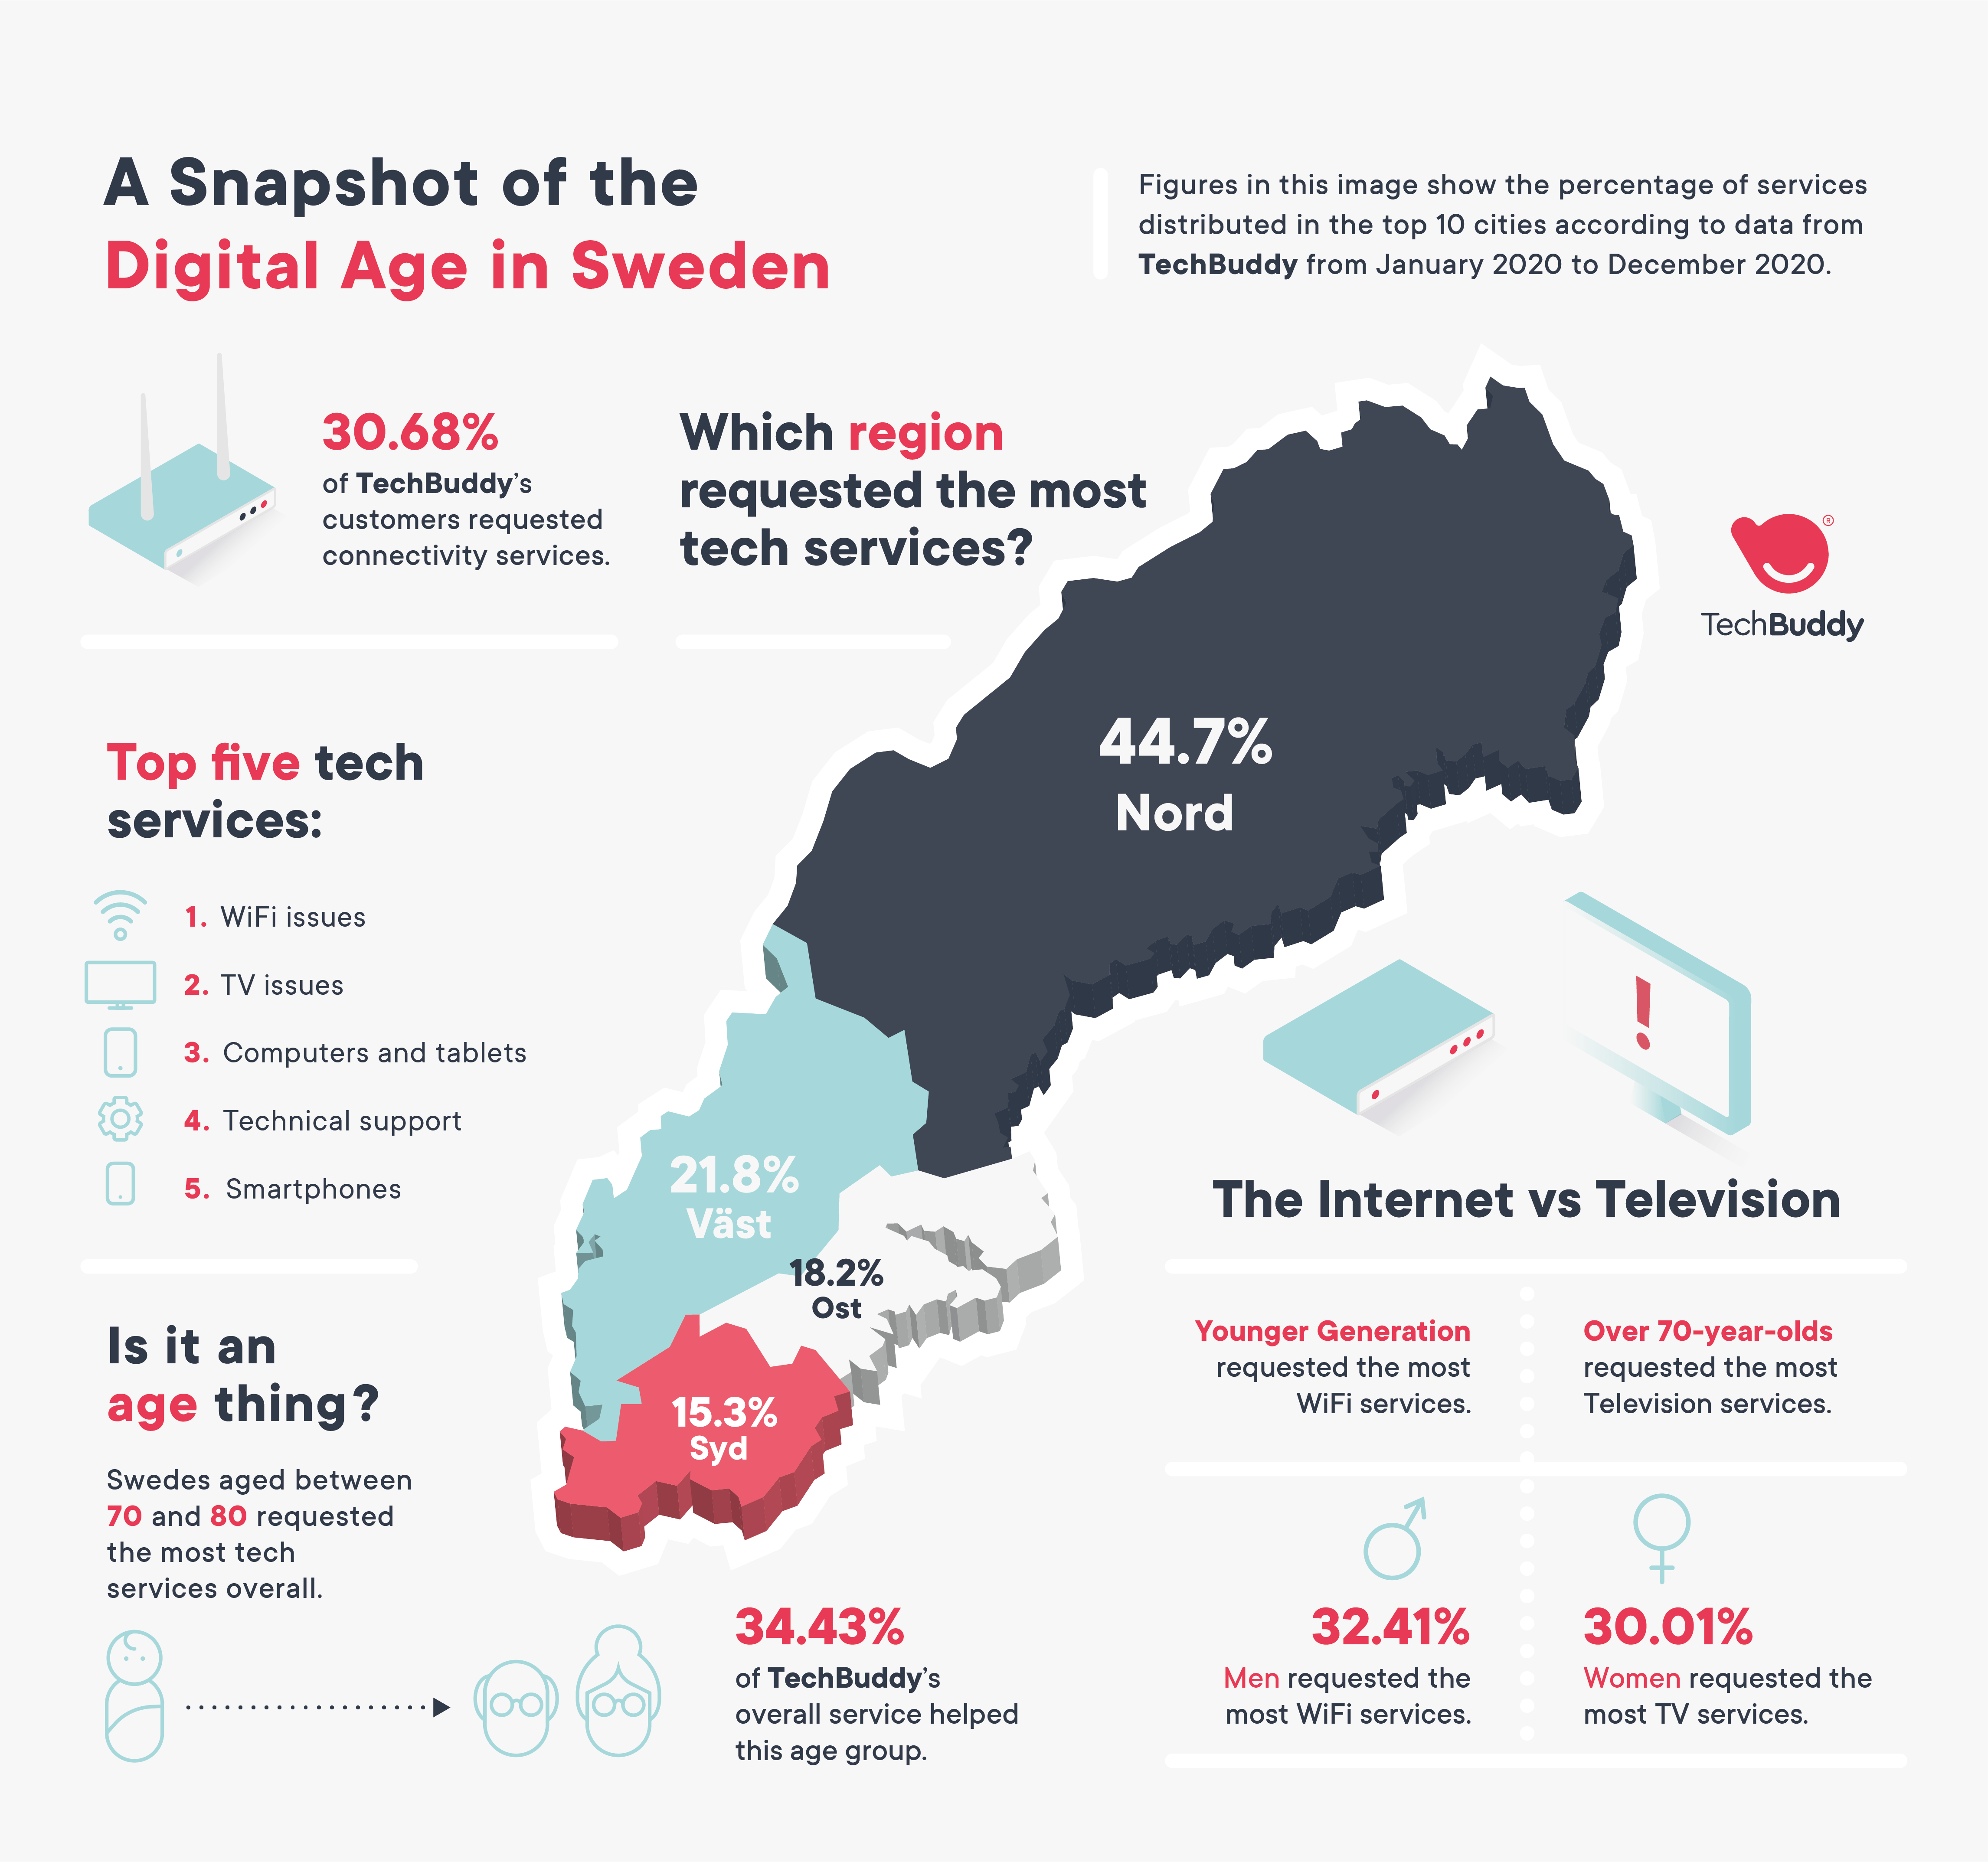
Focusing on a range of different factors such as gender, age and location, the data uncovers that people living in the South of Sweden (15.3%*) are less likely to request technical services. In comparison, those living in the North of Sweden (44.70%*) requested the most technical services in 2020.
The data reveals that men (53.2%) request more technical services than women (44.84%) (2). This is particularly interesting as women among all age groups utilize RUT services more than men. Tech services benefit the entire household, but this data could suggest that women are more tech savvy, as they rely on the service the least.
Unsurprisingly, age created a divide, with over 70-year-olds (30.58%) requesting services the most for television, unlike people under 70 (42.84%) who request services for WiFi and connectivity issues the most.
David Fauné, Country Manager Sweden, at TechBuddy says, “Over the past 20 years technology has improved quicker than it did in the 20 years prior. Which is why we think it’s important to stop, reflect and look at how we’re actually interacting with technology, especially now that it has become such an integral part of all of our daily lives.”
Television use has declined over the last decade. Initially, the average Swede spent 166 minutes watching television daily, by 2020 this has reduced to 129 minutes (3).
“Television caused the least issues for the younger generation, which for us wasn’t surprising. It has been in steady decline with the takeover of big streaming services dominating the small screen, and most people now choose to watch their favourite shows via laptops and tablets. This is another example of how technology is evolving at speed, right before our eyes.
Over 60’s watch the most television, up to 277 minutes per day in comparison to the younger generation, with 24 minutes per day (4). This explains why the older generation needs more services connected to TV.”
To support the data TechBuddy has created a snapshot image (see below) to clearly show the different factors that impact our newfound relationship with technology.
TechBuddy is on a mission to enhance a digital and connected life for all, from offering support to those struggling with tech or simply offering tech services as a commodity in the home to save time, similar to housekeeping.
By widely sharing this data, TechBuddy hopes to provide insight for everyone to better understand how our relationship with technology differs around the country, between gender and age, as it continues to unfold.


